AKT Statistics: Interpretation for Clinical Practice
Live online revision for GP trainees who want to feel calmer and more confident with statistics, evidence interpretation and AKT data questions
Choose the format that suits you:
Three Wednesday evenings: 27th May, 3rd June & 10th June
One day online course: 18th June
Delivered live on Zoom
Early bird: £70 (until May 20th 2026)
Standard price £82.50
Why this course?
Statistics is a relatively small part of the AKT, but it is an area many trainees avoid, overcomplicate, or feel uncertain about.
This course is designed to help you approach AKT statistics more calmly and more safely. The focus is not advanced maths. It is understanding what the question is really asking, interpreting data accurately, and avoiding common misunderstandings.
GP Fluency’s approach is grounded, practical and exam-focused. The aim is to help you make sense of statistics in a way that is useful for the AKT and relevant to clinical practice.
Who this course is for
This course is suitable for GP trainees preparing for the AKT, particularly if:
statistics feels like an area you want to strengthen
you lose marks on graphs, risk questions or evidence interpretation
you want a clearer framework for understanding common AKT data questions
you prefer interpretation and meaning over formula-heavy teaching
-
The course focuses on the areas of statistics and evidence interpretation that commonly cause difficulty in the AKT.
-
Including:
normal and skewed data
mean, median, SD and IQR
standard deviation versus standard error
screening tests, prevalence and predictive values
common pitfalls in interpreting diagnostic and screening questions
-
Including:
absolute and relative risk
baseline risk
number needed to treat and number needed to harm
odds ratios, hazard ratios and confidence intervals
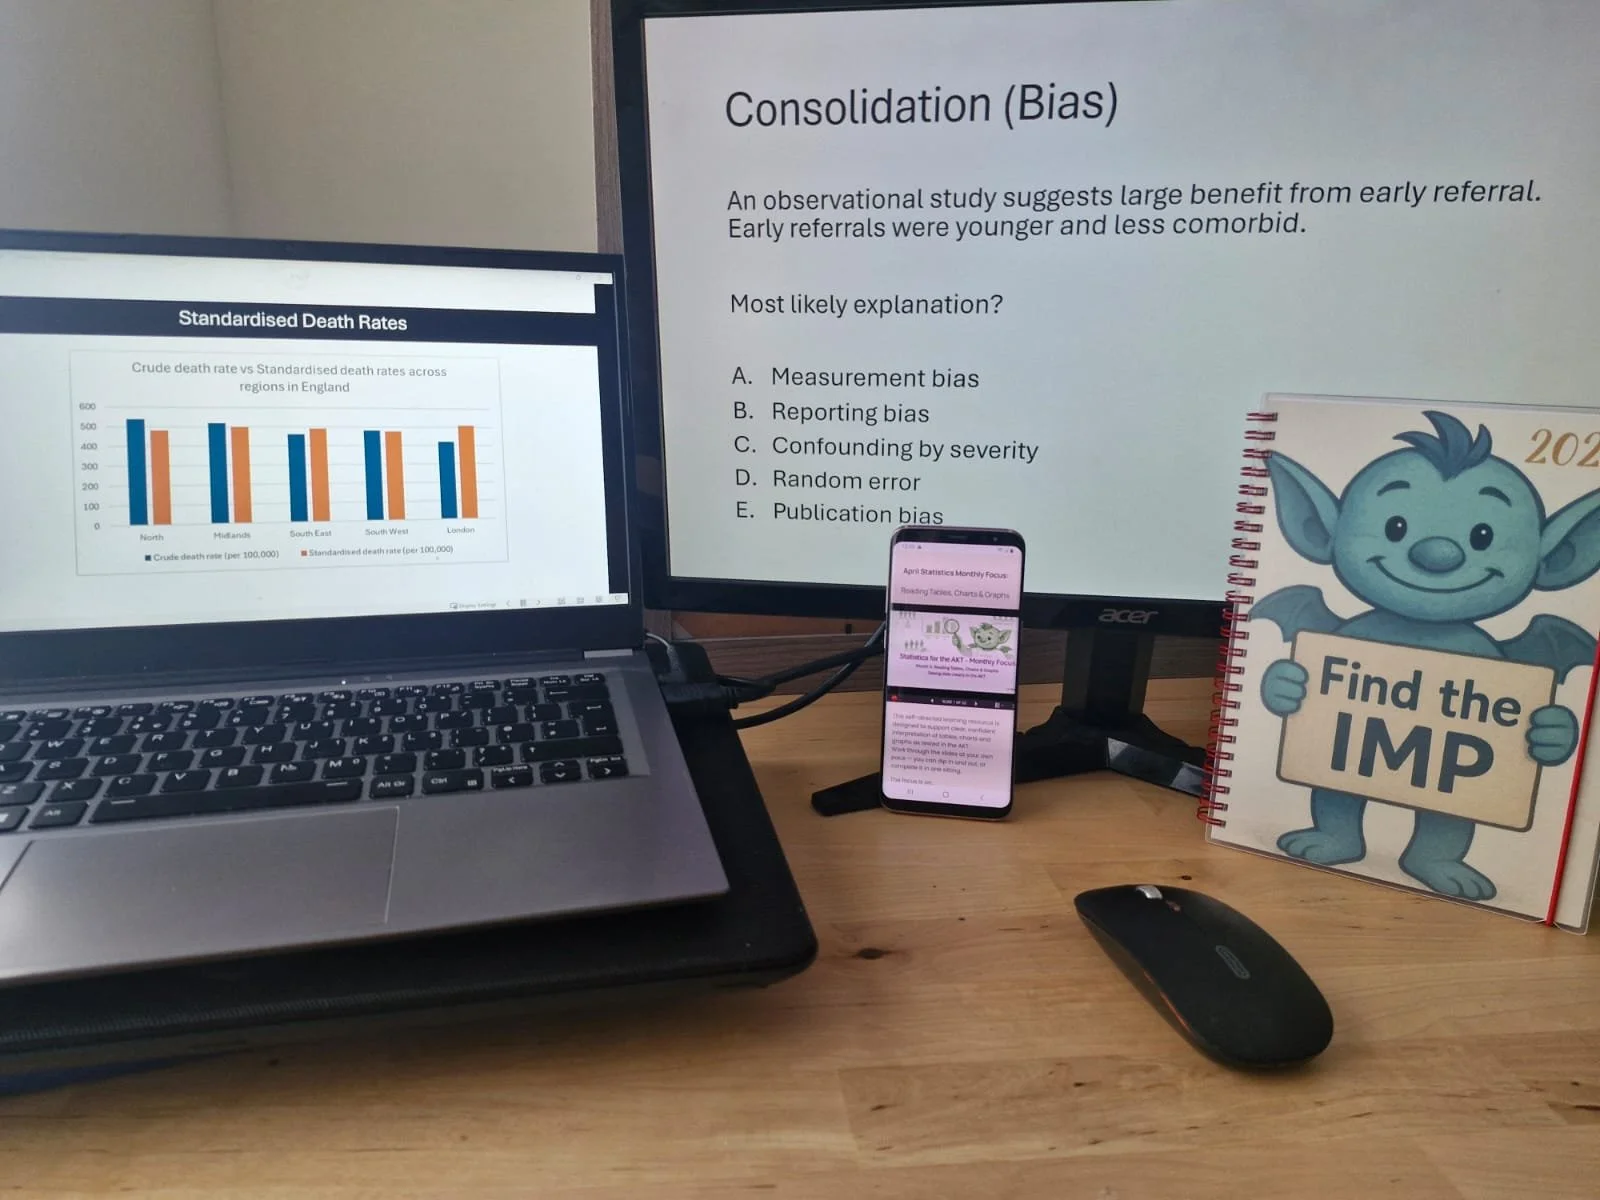
bias, confounding and cautious interpretation of research findings
-
Including:
forest plots
funnel plots
cancer risk charts
Cates charts
decision aids
screening bias
common AKT visual data formats and how to interpret them safely
This is delivered in the same session as 3b: Timed AKT-style “mini mock” with guided walkthrough
-
The course includes a short timed set of AKT-style data interpretation questions delivered live on screen, followed by a structured walkthrough of answers, reasoning and exam technique.
This is delivered in the same session as 3a: Interpreting AKT visuals and data formats.
What you will leave with:
interpreting common AKT statistics questions
making sense of visual data and research figures
distinguishing relative from absolute effects
approaching screening and diagnostic test questions more safely
recognising what the exam is really testing
avoiding overthinking and overclaiming
You will also receive take-home summary resources to support consolidation after the session.
Course format
Both course options cover the same content and are delivered live on Zoom.
Option 1: Three-evening course
Wednesday 27 May
Wednesday 3 June
Wednesday 10 June
Ideal if you prefer to spread the content over three shorter live sessions.
Option 2: One-day online course
Thursday 18 June
Ideal if you would rather cover the same material in one focused study day.
Pricing
Both course options cover the same content and are delivered live on Zoom.
Early Bird: £70 until May 20th 2026)
Standard Price: £82.50