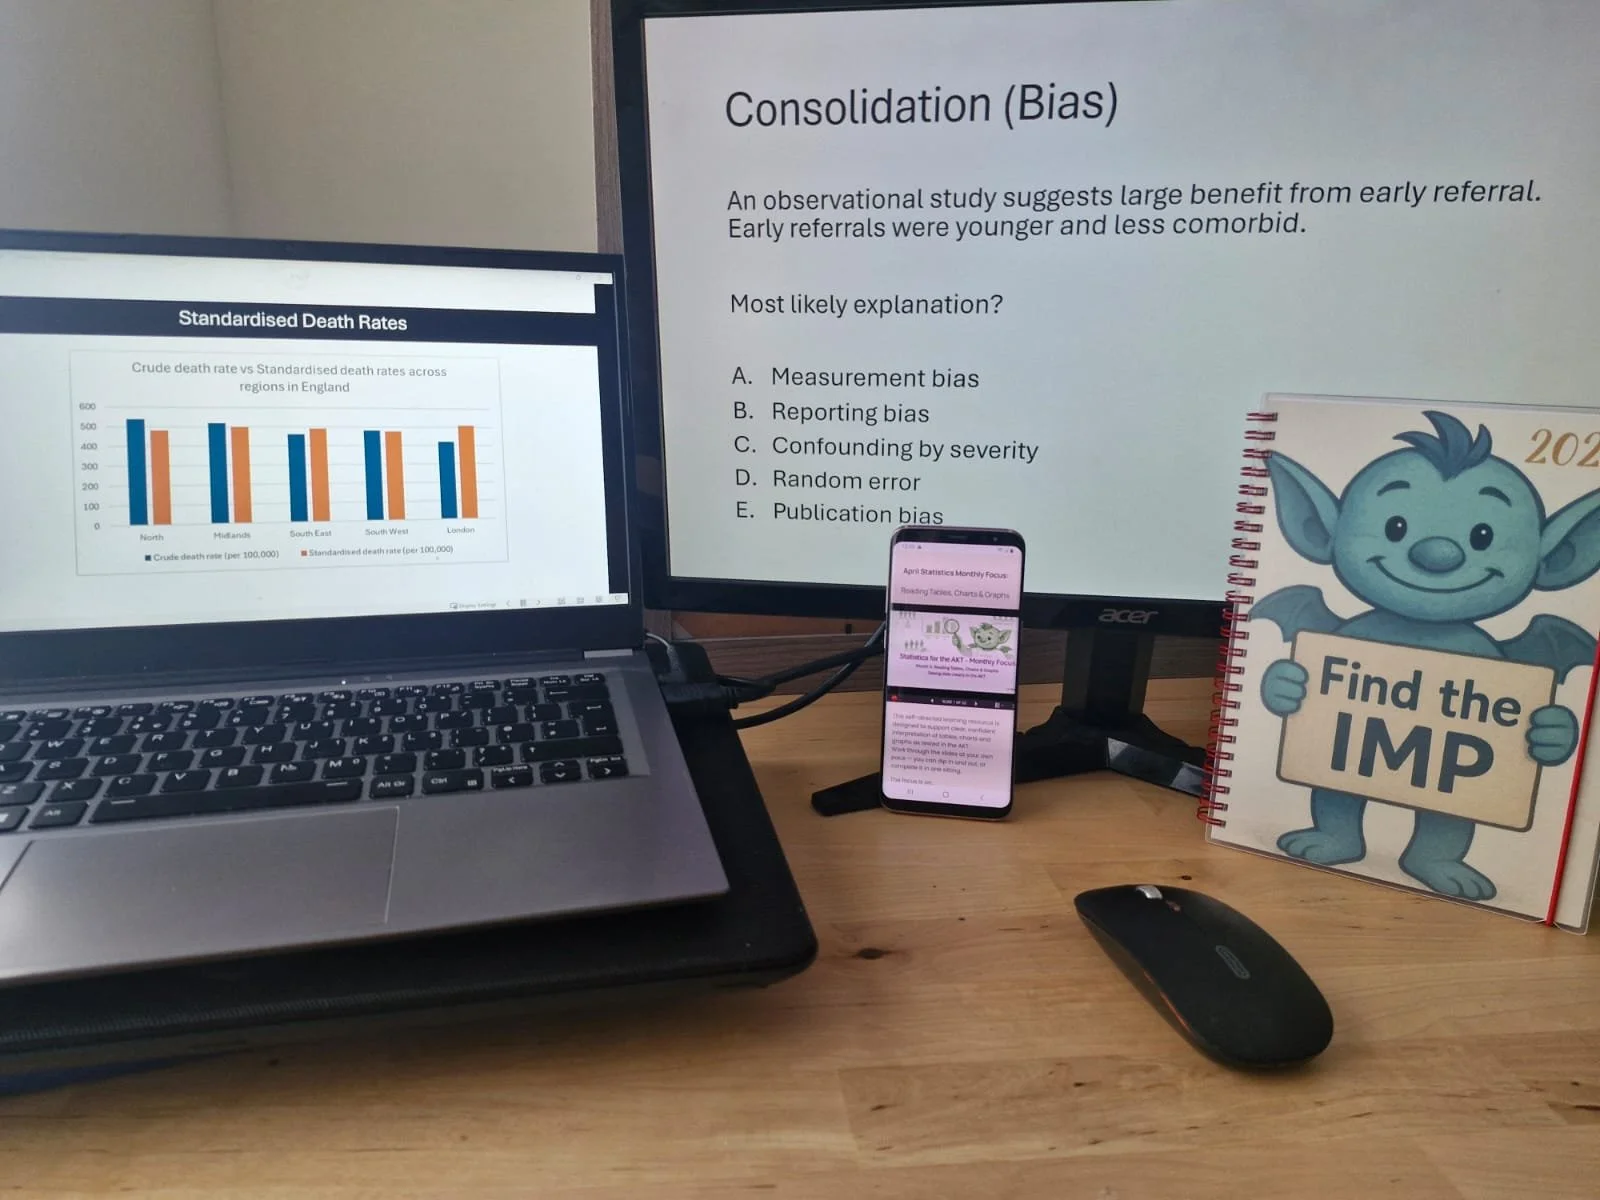
Delivered live on Zoom
Standard price £82.50
Early bird discount for 2027 courses - book by 1st December and secure your place for just £70
More details (indicative content, format etc) below
Choose the date that suits you
Our one-day, live online AKT Statistics course is available on three dates in 2027:
Thursday 7 January 2027
Tuesday 13 April 2027
Thursday 17 June 2027
Live online revision for GP trainees who want to feel calmer and more confident with statistics, evidence interpretation and AKT data questions
AKT Statistics for GP Trainees: Interpretation for Clinical Practice
About this course
This one-day course focuses on the statistics, evidence interpretation and data presentation skills commonly tested in the AKT.
The teaching is structured, practical and exam-focused, with an emphasis on interpretation rather than complex calculation. The aim is to help trainees understand what AKT statistics questions are really asking, recognise common data formats, and approach evidence-based medicine questions with more confidence.
The course is designed to make statistics feel more clinically relevant, using the kinds of risk, evidence and visual data that GPs need to interpret in day-to-day practice.
What is included
Live one-day teaching, delivered either in person or online via Zoom
(please check individual dates for delivery format)Focused teaching on AKT statistics, evidence interpretation and data handling
Coverage of common AKT visuals, including charts, plots, screening data and research summaries
A short timed set of AKT-style data interpretation questions
A structured walkthrough of answers, reasoning and exam technique
Take-home summary resources for consolidation after the course
Course content
Session 1
Understanding data, variation and test interpretation
Normal and skewed data, summary measures, standard deviation, standard error, sensitivity, specificity, predictive values, prevalence and test interpretation.
Session 2
Risk, evidence and effect measures
Absolute and relative risk, baseline risk, NNT and NNH, odds ratios, hazard ratios, confidence intervals, p-values, study design, bias and confounding.
Session 3
Interpreting AKT visuals and data formats
Cates charts, cancer risk charts, prescribing data, standardised rates, line charts, forest plots, funnel plots, heterogeneity and screening bias.
AKT-style interpretation questions
A short timed question set followed by a structured walkthrough of answers, reasoning and exam technique.
Who this course is for
This course is suitable for GP trainees preparing for the AKT, particularly those who want to strengthen their confidence with statistics, evidence interpretation and data-based questions.
It may be especially helpful if you:
feel uncertain about graphs, risk, confidence intervals or evidence questions
find statistics difficult to revise alone
want a clearer approach to interpreting research and visual data
prefer focused, live teaching with explanation and walkthrough
want to practise applying statistical concepts in an AKT-style format
Important information
This is a live course. Online dates are delivered via Zoom.
In-person and online one-day courses cover the same core content
Places are limited to support interaction and discussion.
For GP training programmes
We can also deliver a dedicated AKT Statistics course as part of your teaching programme.
Please email Erin to discuss a date that suits your trainees.
What delegates say
“….small group teaching, easy to follow…..”
“…explanations clear and helpful…”
“…clear and easy to digest…”
“…I’m feeling less scared of statistics now…”
“…facilitator clear and interactive, I could ask questions…”
“…liked the small group format, it worked well…”
What TPDs say
“…trainees find fluency sessions memorable and useful…”